Dashboard | Overview
The Dashboard page is designed to provide actionable insights to best manage one's workforce. The Dashboard can be configured as a page for both Enterprise and Marketplace level users.
Dashboard Components
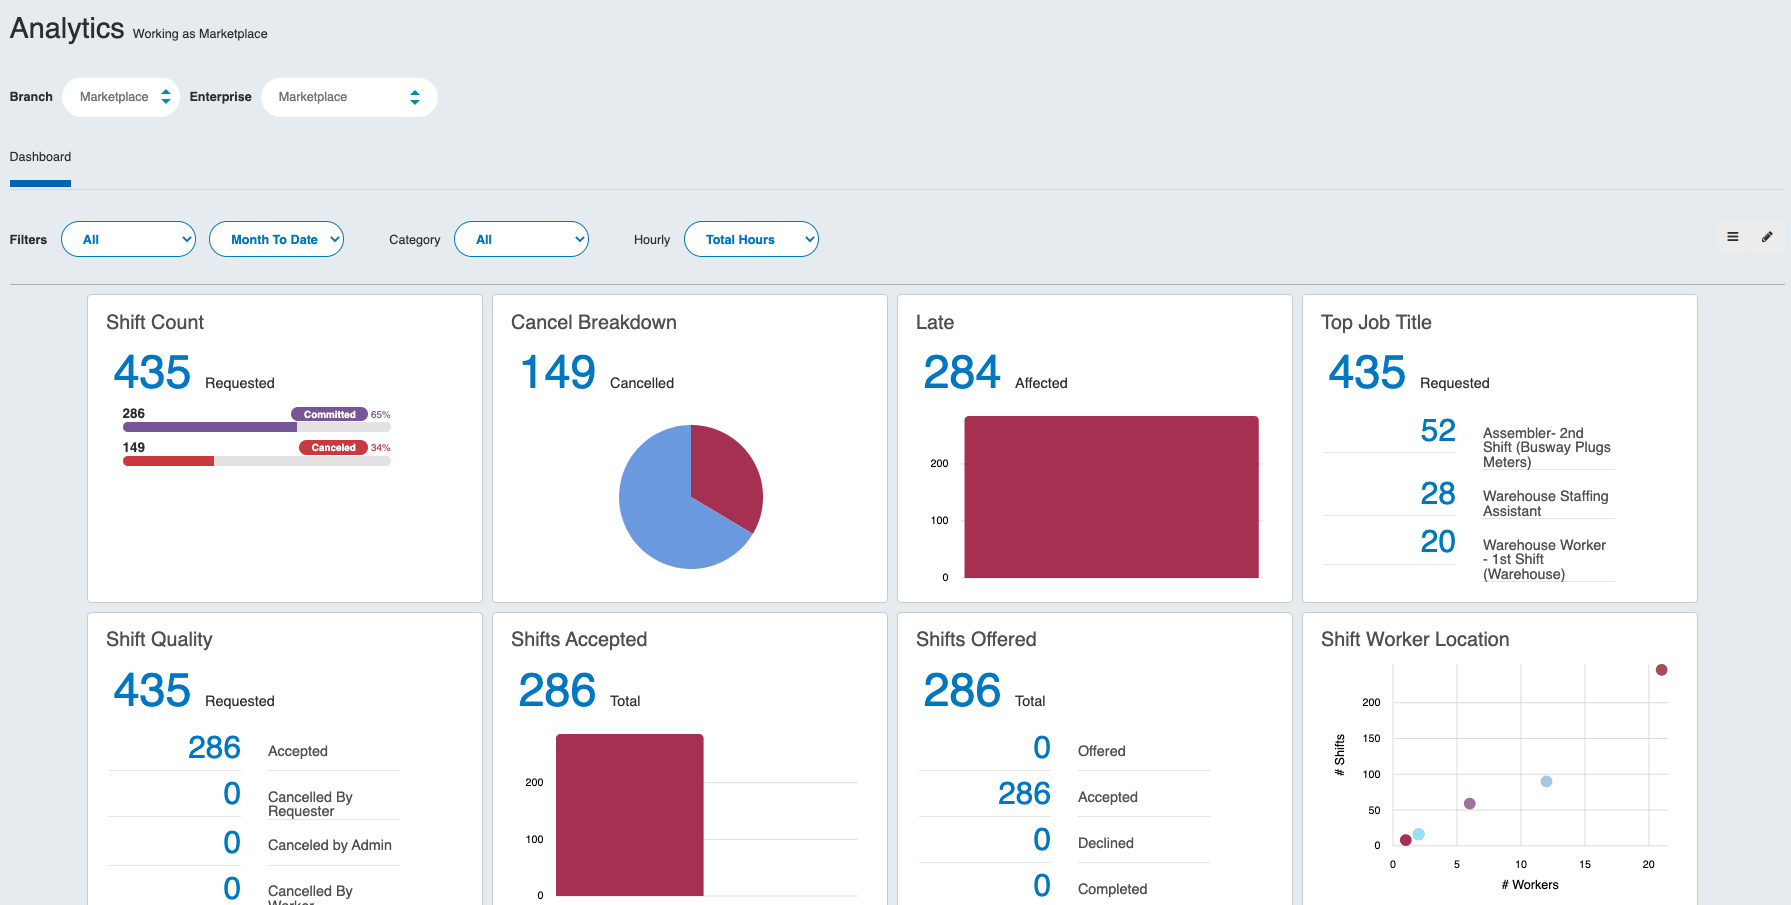
The Dashboard is composed of many individual widgets that display a defined set of data.
Widgets provide information on:
- Fill rate breakdown
- Number of shifts being canceled
- Number of Talent who are late to check-in or running long on their shifts
- Quality metrics
- Financial data
- Other business health and trend indicators
Organizing Widgets
Rearranging Widgets
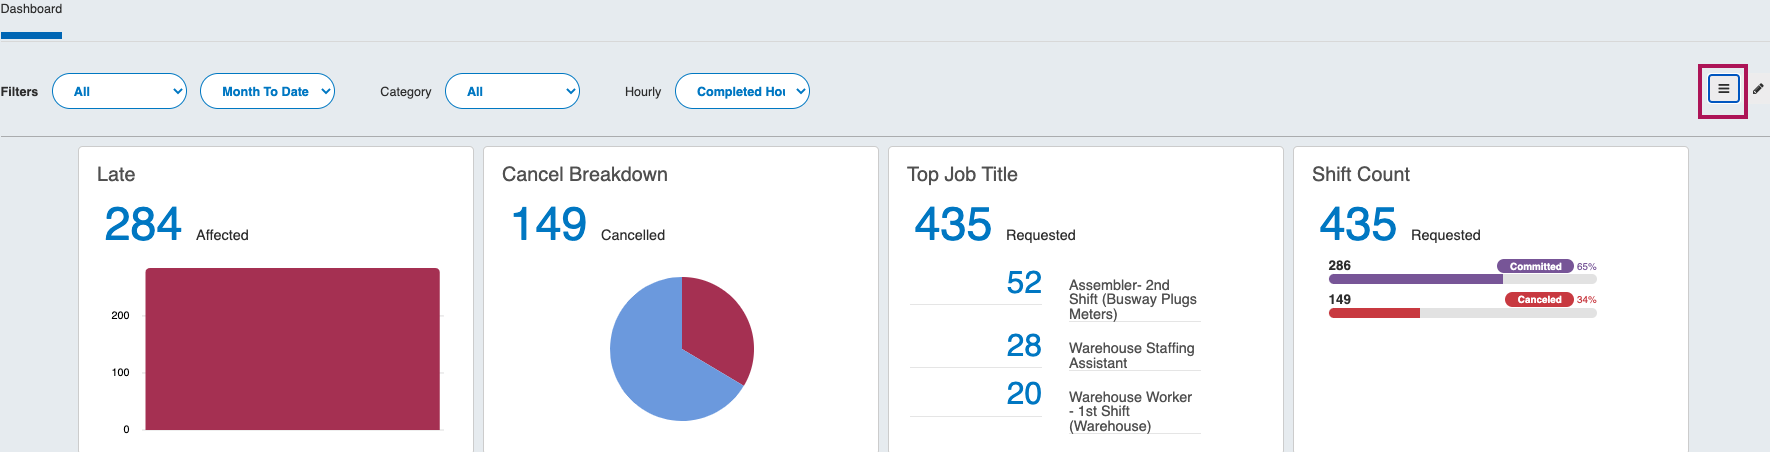
By clicking the top right icon with three lines, the widgets can be moved around in any order that suits a user best.
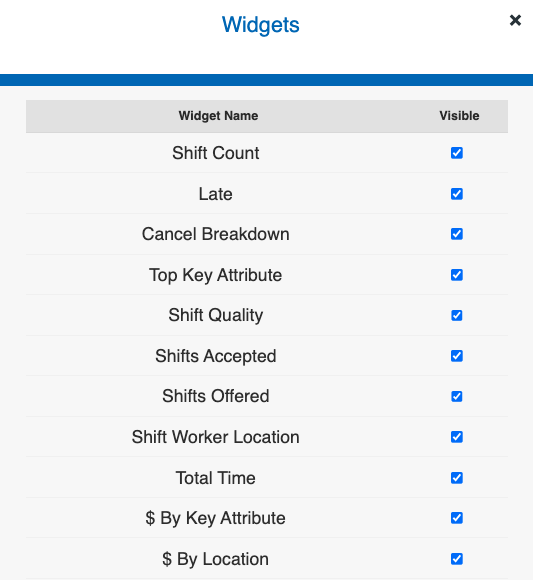
Showing/Hiding Widgets
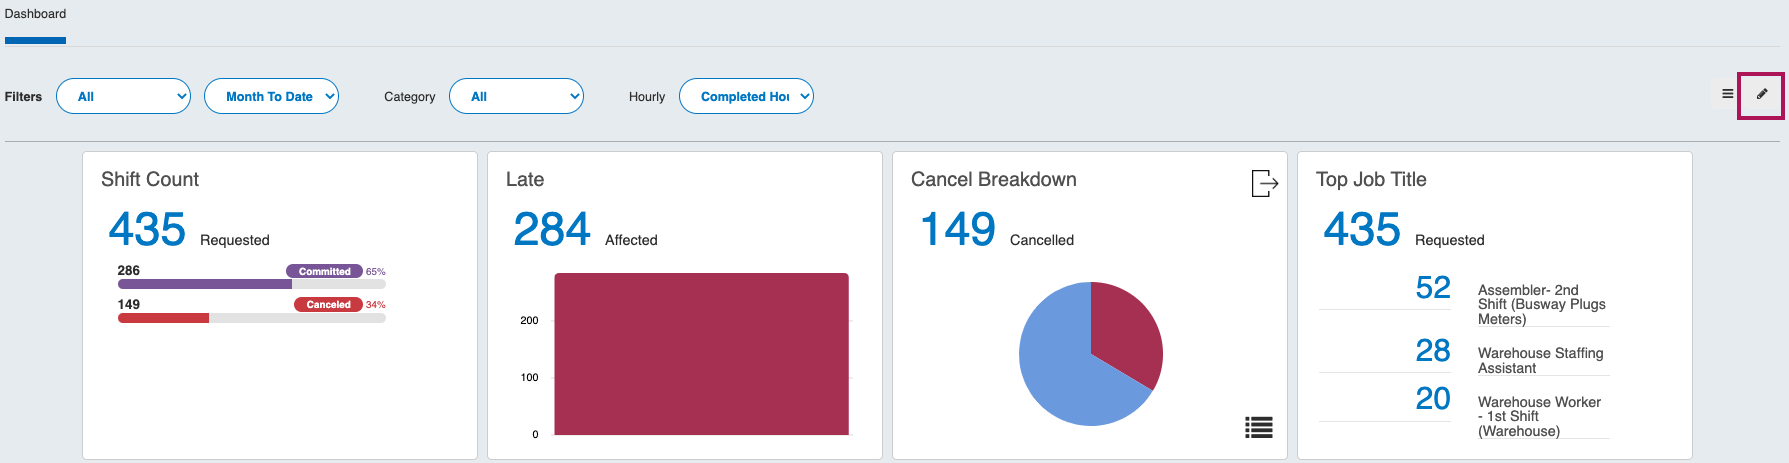
By clicking the top right pencil icon, widgets can be hidden or shown.
Filtering Data
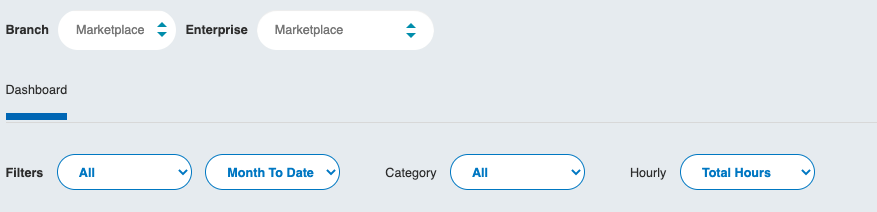
Users can further filter down to the data that is important to their needs. Either view the Marketplace as a whole, or drill down to a specific client's Enterprise by selecting from the Filter by Enterprise drop down.
Additional Filter Options
Worker Type: This filter shows the data by Contractor or Staff. Contractor refers to Talent of the Marketplace, versus Staff which would be a client's internal employees (this is only relevant if the clients use the tool for internal scheduling). In most cases, this filter should be kept to 'All'.
Date Range: This filters down the data based on a chosen date range. This can be viewed based on weekly ranges, monthly ranges, or set a custom range.
Widget Category: This filter only displays widgets focused on standard shift data, quality, or financials.
Hourly: This filters the Total Time Widget into different types of hours, such as Committed, Active, and Completed.
Drilling Into the Data
Most Dashboard widgets can be viewed in 2 modes, graph-based or text-based. Widgets can be toggled using the pie chart icon on the lower right-hand corner of each widget. Hovering over graphical elements will display the corresponding data.
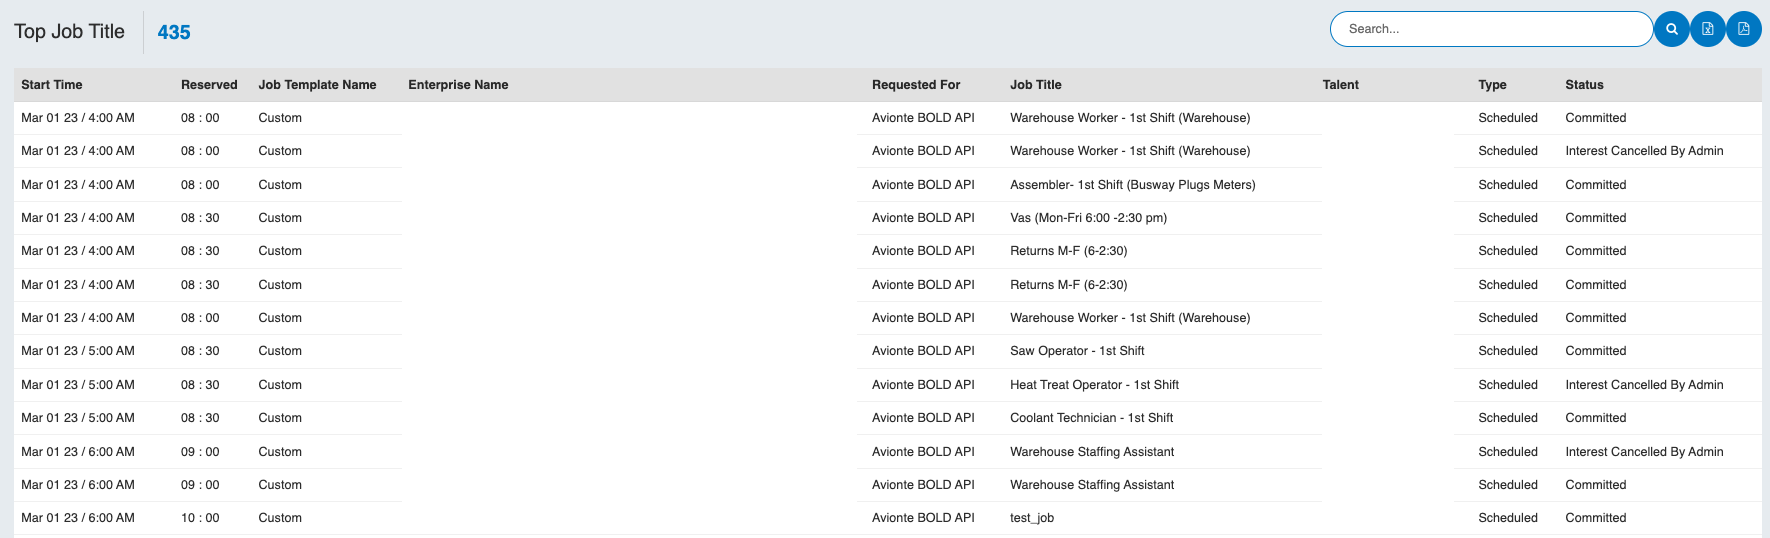
By clicking on the widget, the data can be viewed in a spreadsheet-style fashion. From here, any number, row, or graphical element can be clicked on to access the list of associated shifts.
By clicking on the Worker's name, the worker's profile will come up so their contact info or profile data can be reviewed. Clicking anywhere else on the row will display the details of the request.
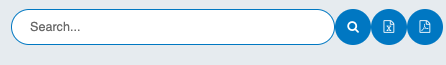
Search and Export
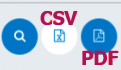
In the top right area, there is a search box to find a specific worker, job, or template. This report can also be exported to CSV or PDF via the buttons in this area
Updated 8 months ago